 Your Place · Data
Open the app
How it works
Open data about your city, on a 3D model
How steep its streets are, how busy, how its trams and buses run, what homes cost and what people earn: search a place and Your Place · Data builds the square around it (300 m to 4 km) in your browser, the real terrain with every mapped building, and lays one layer of open data over it. It’s free, needs no account and works on a phone.
Three steps
-
Pick a layer and a place. An address, a street, a village, a postcode or raw coordinates such as
48.7765, 9.1772, or one of the examples on the start page. - Look around. Drag to turn and tilt, pinch or scroll to zoom, two fingers (or Shift-drag) to slide. Tap a building to put the pin on it and see its area’s value. Double-tap or double-click a spot to load the area around it.
- Share it. A link opens the same view, layer and pin; or download it as an image, with your own title.
The layers
- Steepness: roads and paths coloured by how steep they are, anywhere, from golden yellow (3–6 %) to dark red (over 15 %), measured on the terrain over 60 m at a time. The terrain data has points 10–30 m apart, so it’s an estimate: short ramps and stairs can be missed, and bridges are left out.
- Traffic: the cars or bikes Hamburg counted in each of the last 24 hours, as red streets that rise with the traffic, with a bar chart of the day. Each count spreads along the streets around its counting point; in between it’s an estimate. Only Hamburg so far.
- Public transport: trams, buses, trains and ferries moving through the square as your city’s timetable has them, with the trips per hour and a replay of the day. Find your city’s timetable in the panel (from the Mobility Database), or load a GTFS file from your transit operator. The timetable is the plan, not live: delays and cancellations don’t show.
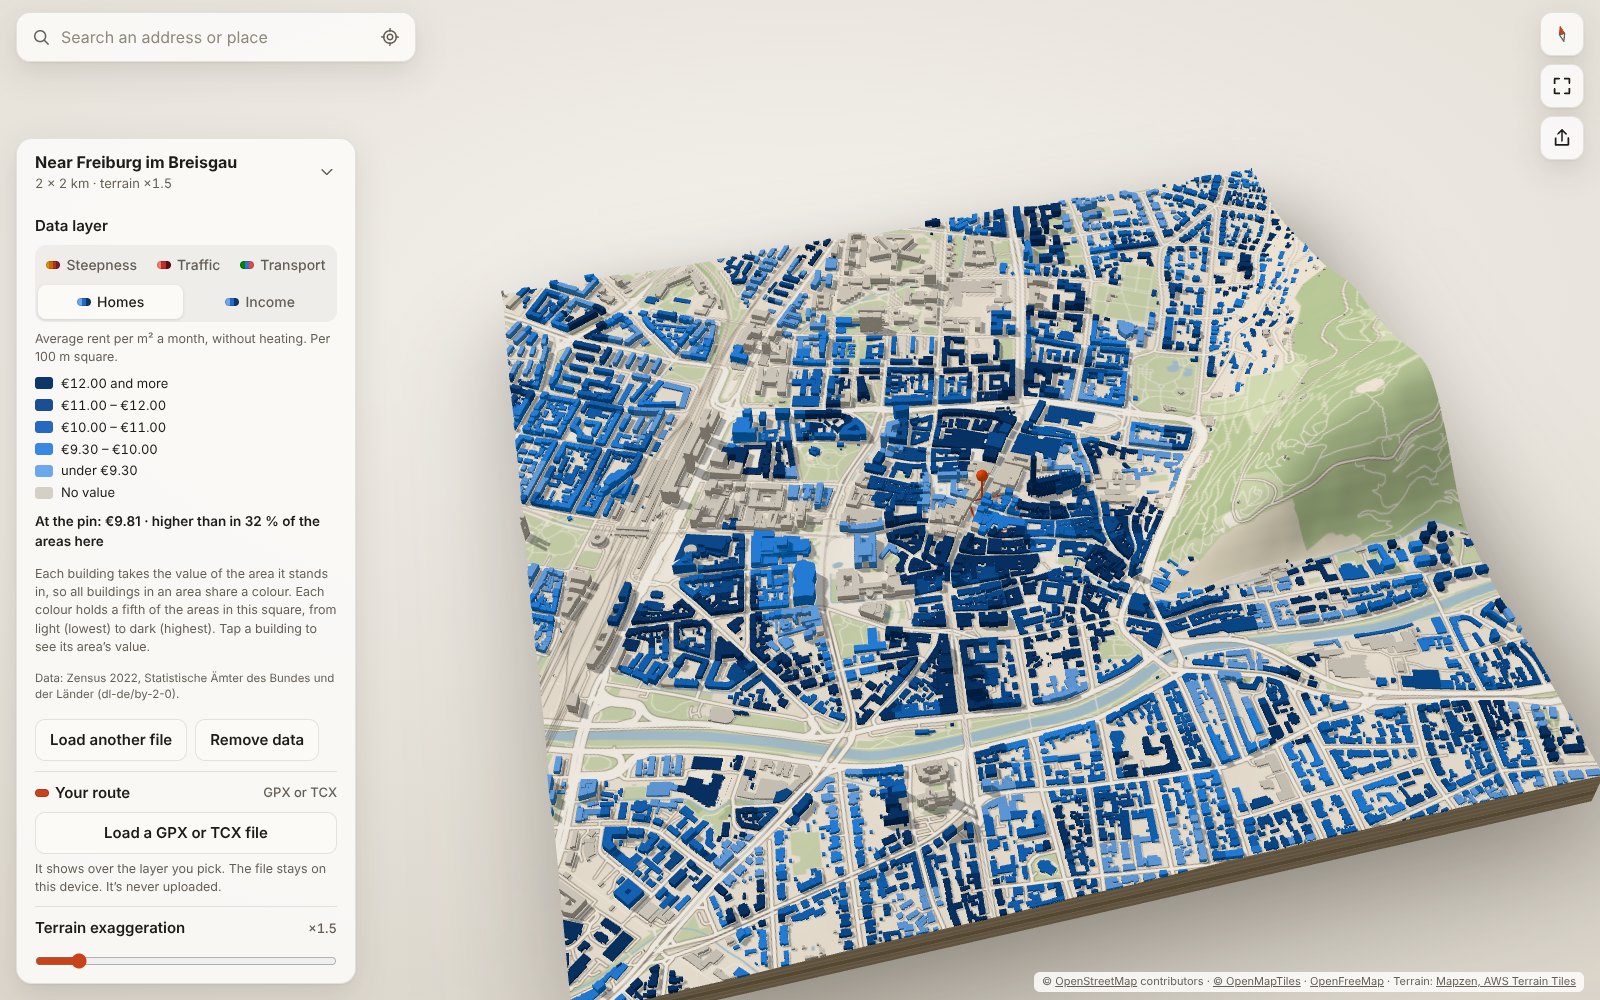
- Homes and Income: the buildings coloured by what homes cost or what people earn in the area they stand in. The panel lists the open sources known for your place (Germany’s 2022 census rents, CBS for the Netherlands, the US census via Census Reporter); any GeoJSON or CSV file with values per area works too. Five colours each hold a fifth of the areas in the square. Single points, such as sales, show only as medians of 100 m squares with at least five.
- Your route, over any layer: a run, a ride or a race from a GPX or TCX file, with its steepest climbs, a height profile and a replay at the recorded pace.
The model under the data
- Terrain from open elevation data. Hills can be exaggerated from 1× to 5× and drawn with contour lines.
- Buildings at the height recorded in OpenStreetMap, or its number of floors × 3 m. Where neither is mapped, the height is estimated from the neighbourhood, and the app says what share of buildings that is.
- Roads, water and green areas on the ground, each of which you can switch off; the sea from OpenStreetMap’s coastline.
- In English, Spanish, Portuguese (Brazil) or German, following your browser’s language, or picked in the settings. This page is in English only for now.
Privacy
- No account, no cookies, no analytics. Your Place · Data has no server of its own: the app runs in your browser.
- What you type in the search box goes from your browser to the address search services Photon (by komoot) and, if needed, Nominatim (OpenStreetMap), which return its coordinates.
- Share links hold only coordinates, the view and the layer, never the address you typed or a file you loaded.
- Map data you have loaded is cached on your device so it opens faster next time.
- Files you load (a route, a timetable, values per area) are read in your browser and never uploaded or stored; reloading the page forgets them. Share links include a route only if you tick that, and then only the stretch shown, without times or a name.
- With the traffic layer on in Hamburg, the corners of the square you’re looking at go to the City of Hamburg’s traffic server, which returns its counts.
- “Find timetables for this place” downloads the Mobility Database’s whole list of timetables, the same for everyone, and picks those for your place on your device; loading one downloads it from the Mobility Database, which so learns which timetable you chose, not where you’re looking.
- “Load for this square” (Homes and Income in the Netherlands) asks the Dutch statistics office’s map server (PDOK) for the corners of the square shown; the other sources are links you open yourself.
Questions
A building is missing, or flat
Buildings come from OpenStreetMap, which volunteers map by hand. Cities are well covered; some villages have few buildings, and many have no height recorded. You can add a building, or its number of floors, yourself on openstreetmap.org, and it shows up here once the map tiles update.
Why is there no data for my city?
Each layer needs open data for the place: steepness works anywhere, traffic counts are only Hamburg’s so far, and timetables and values per area are published city by city and country by country. Where the panel knows no source, a file of your own works.
Which devices work?
Any current browser with WebGL 2: Safari, Chrome, Firefox or Edge, on a phone, tablet or computer. You can also install it as an app from the browser menu.
Can I share what I make?
Yes. Credit the data where you show it: “© OpenStreetMap contributors” for the map, and the layer’s source as the panel names it. Downloaded images carry the credits already.
Data sources and credits
- Map data © OpenStreetMap contributors, ODbL
- Vector map tiles: OpenFreeMap, schema © OpenMapTiles
- Terrain: Mapzen terrain tiles on AWS Open Data
- Address search: Photon by komoot, Nominatim
- Fallback map data: Overpass API
- Traffic counts: Freie und Hansestadt Hamburg, Behörde für Verkehr und Mobilitätswende, dl-de/by-2-0, via the city’s SensorThings API
- Timetables for a place: found through the Mobility Database by MobilityData, each credited with its operator and licence in the panel
- Freiburg’s timetable (public transport example): Freiburger Verkehrs AG (VAG), dl-de/by-2-0, cut down to what the app uses
- Rents (Homes): Zensus 2022, Statistische Ämter des Bundes und der Länder, dl-de/by-2-0; the Freiburg example is cut from it
- Home values and incomes for the Netherlands: CBS, Kerncijfers wijken en buurten, via PDOK, CC BY 4.0; the Amsterdam example is cut from it
- Home values and incomes for the US: U.S. Census Bureau, American Community Survey, via Census Reporter
Your Place · Data is open source under the MIT licence: github.com/yourplace3d/3d-city (branch v2). Ideas and bug reports are welcome there.